Finding the Alpha or Beta in Data.

As my Data Science journey has continued in these past few weeks, I’ve learned to extract clean information from raw data to form actionable insights. This has aided in my understanding of LINEAR AND MULTIPLE LINEAR regression, machine learning fundamentals and really caused my curiosity to pique. While continuing to learn daily, my knowledge and confidence has been growing exponentially. I am feeling more driven than ever to start applying what I am learning.

Today I will share a tutorial of Simple Regression Technique in Python.

We’re going to be taking a look at a simple regression technique in Python. There are a plethora of tools available to implement regression in Python. We are going to look at a couple of them, specifically, what you can do with Numpy. It is not meant to be an exhaustive tutorial on all the methods of regression in Python and we’re not going to be running any statistical tests. We are just going to be fitting a line and then visualizing the output of that fit line.

The first step is to import these libraries. Libraries are a Data Scientist’s best friend. In Data Science, there is always a lot of action going on behind the scenes. At first glance they look like words, but behind every “Import” there are a wealth of features that can help you in your coding and your project.

import numpy as np
import pandas as pd
import pandas_datareader as pdr
import matplotlib.pyplot as plt
import seaborn as sb
sb.set()
import datetime as dt
from datetime import date
import requests
from bs4 import BeautifulSoup as soup

We’re going to run this cell.

Get data for SPY and GOOG

Next we’re going to go out and gather our data. Data for Google and the S&P 500 etf . We’ll go back about a year okay(365) and then we’ll store our data using the pandas datareader and the Yahoo Finance API.

stocks = "GOOG SPY".split()
start = dt.date.today() - dt.timedelta(365)

We then create another variable named “data”.

data = pdr.get_data_yahoo(stocks, start)
data.head()

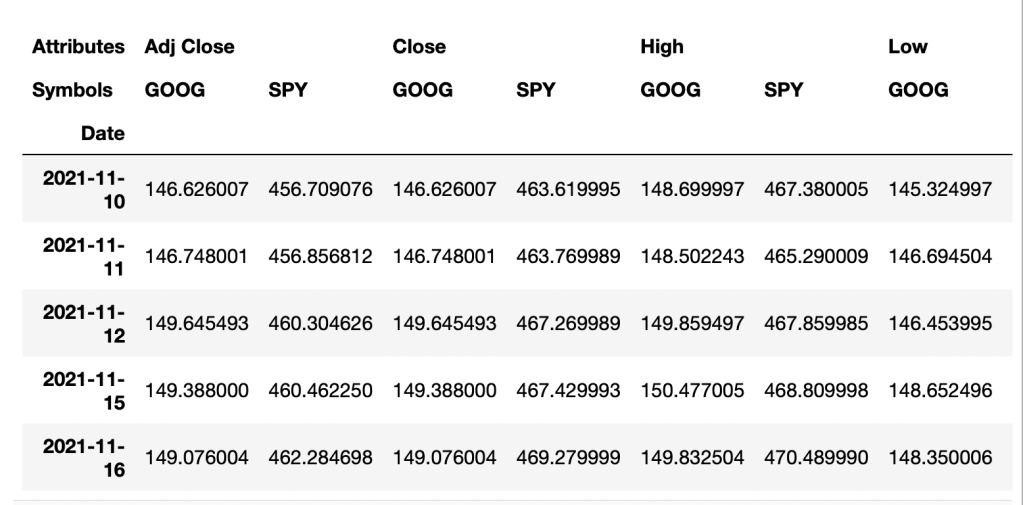
By adding (.head) this will show you the first few lines of your dataset. We actually don’t need all of this data, so you can see we get a high low open close and an adjusted close and volume. All you really need is the close for what we’re going to be doing, so I’m going to go back and adjust the data by adding [“Close”] to the data set below:

data = pdr.get_data_yahoo(stocks, start)["Close"]
data.head()

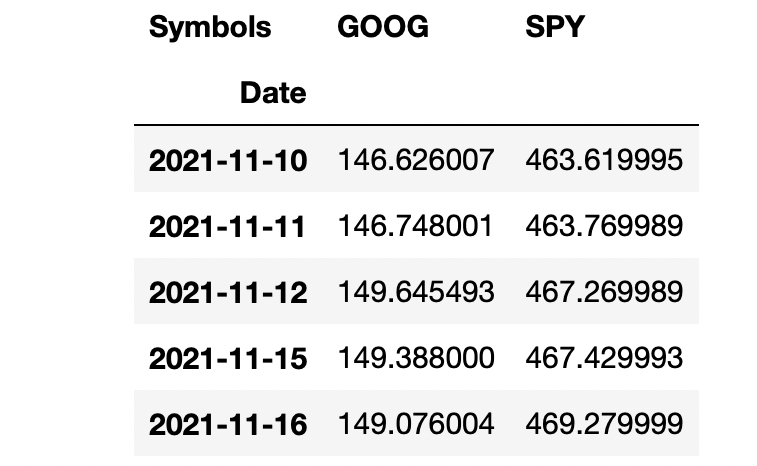
We’re not going to be using the closing prices directly, so I’m going to calculate the instantaneous rate of returns for both Google and the S&P 500 etf.

returns = np.log(data).diff()
returns.head()

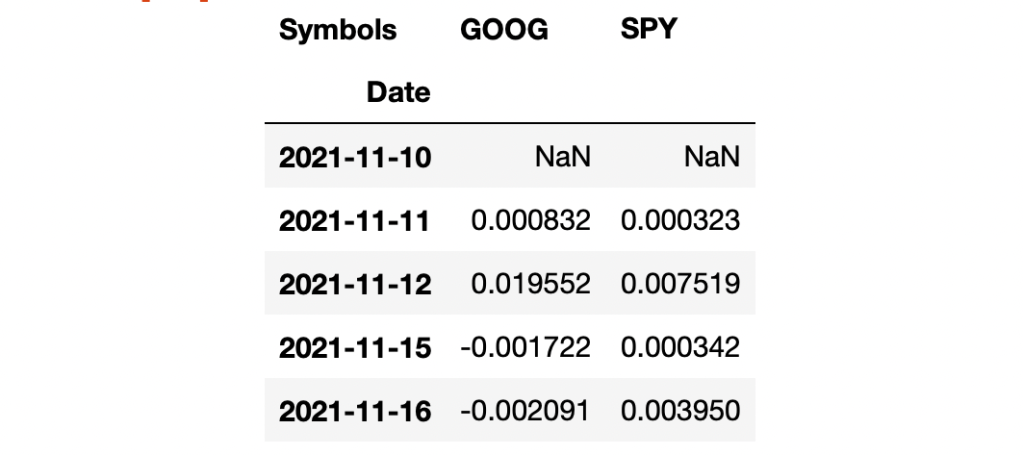
I notice the first value can not be calculated so I will drop that nan by adding “.dropna()”. You can either re-type or copy from the cell above.

returns = (np.log(data).diff()).dropna()
returns.head()

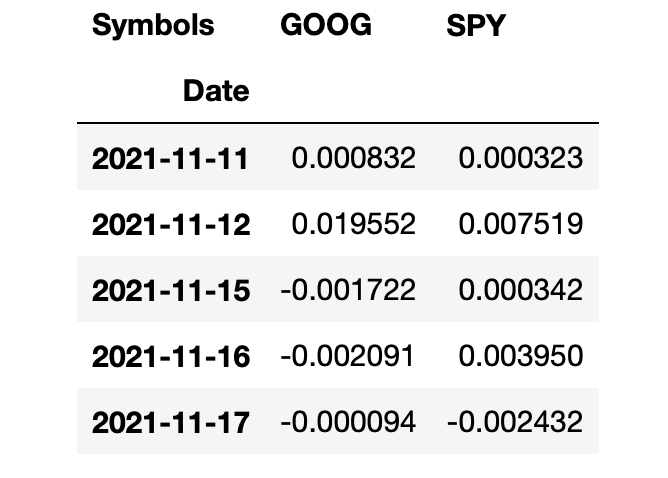
With all that, we are now ready to sort of start looking at a regression. I think the first thing that makes sense to do is probably get a correlation here. So I will take our returns and I’m going to apply the pandas method (.corr) and we can see they’re pretty strongly correlated.

sample= returns.sample(60).corr()
sample

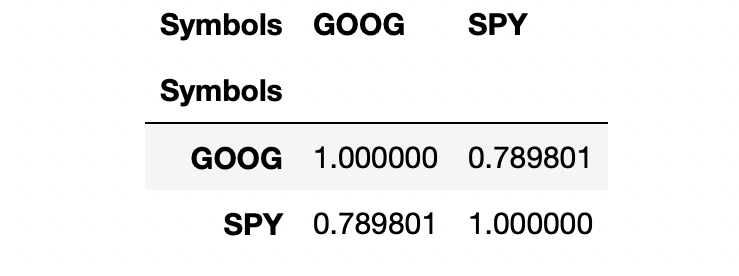
Since the S&P 500 is a market cap weighted index and Google happens to be very large, it’s a question if we’re running a regression here to calculate a beta or something like that. So, the question here is, is Google causing the S&P 500 to go up or is S&P 500 causing Google to go up? We’re not going to try to answer that question. We’re just going to go ahead and put S&P 500 as the independent variable here.

#Its probably better to get a smaller sample so you can have better visibility so I will be sampling this data to 60 returns
#X=being the predictor or independent variable and  
#Y=the dependent variable and Voila! There is our scatter plot
sample = returns.sample(60)
plt.scatter(x=sample['SPY'], y=sample['GOOG']);

View Preview

So now I’m going to set a variable and call it “reg” and I’m going to use the Numpy polyfit.

So we get the “Slope” and “Y” intercept there. So it looks like for every 1.18% the S&P 500 goes up, you can expect GOOG to go down slightly .003 % and this would be equivalent to what we predict as -Beta. It’s unusual for stocks to have a negative Beta. However, a stock with a Beta >1 would mean a volatile stock, and a Beta <1 means it’s less volatile.

Now we can go ahead and plot the scatter plot and plot the trend line. There is our best fit line graphed against the sample
of data points that we chose from above.

trend = np.polyval(reg, sample['SPY'])
plt.scatter(sample['SPY'], sample['GOOG'])
plt.plot(sample["SPY"], trend, 'r');

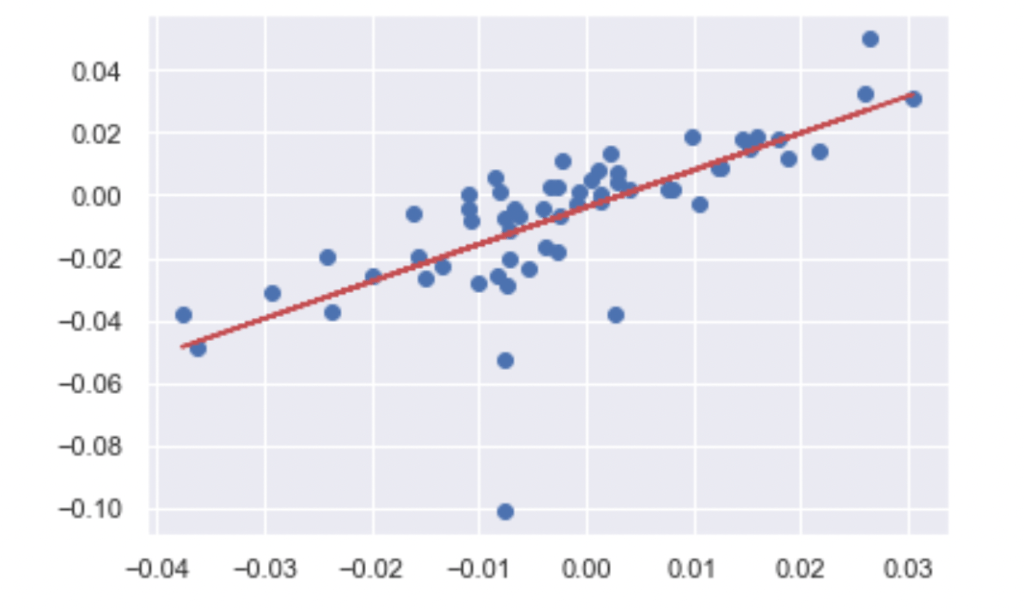
Hopefully, this short tutorial piques your curiosity about what you can learn in Data Science.

Data Visualization is unbiased.

Data visualization possesses the remarkable power to reshape perspectives and influence minds. While raw information can hold intrigue, the act of visualizing this data unlocks heightened clarity, especially in the realm of problem-solving. Data assumes varied roles in the eyes of different individuals; however, to me, its essence is both elegant and profound. It embodies simplicity and beauty, intertwining to unveil insights that resonate.

Simple

Beautiful

As I delved further into the realm of Data Visualization, my fascination led me to the captivating domain of TensorFlow. Renowned as an open-source machine learning framework, TensorFlow stands as a powerful force, driving deep neural networks through its sophisticated high-level coding capabilities.

Crafted by the Google Brain team and unveiled in 2015, TensorFlow holds a distinct allure. Its uniqueness lies in an array of Artificial General Intelligences (AGIs) meticulously designed for data processing, visualization, model assessment, and deployment. This comprehensive ensemble empowers the average developer, rendering the realm of deep learning approachable.

One of TensorFlow’s striking virtues is its remarkable portability. With the capacity to seamlessly operate across a spectrum, from diminutive mobile devices and CPUs to potent microcontrollers and multiple GPUs, it underscores adaptability at its core.

Moreover, TensorFlow boasts a burgeoning community that continually enriches its capabilities, lending a dynamic aspect to this innovative tool. This convergence of accessibility, versatility, and ongoing enhancement renders TensorFlow not just a machine learning framework, but a transformative agent shaping the future of AI-driven applications.

Massive GPUs

Its applications span diverse fields: from medicine, where it aids in detecting objects within MRI images, to Twitter, where it organizes timelines, Spotify employs it for music recommendations, and PayPal relies on it for identifying fraud. This technology’s utility extends into domains such as self-driving cars, natural language processing, and beyond. The possibilities are far-reaching, culminating in the creation of neural networks tailored to your specifications.

Seamlessly interfacing with the user-friendly Keras library, TensorFlow opens its doors to beginners and experts alike. The integration empowers enthusiasts to embark on their neural network journey without encumbrance. For those seeking hands-on exploration, the TensorFlow Playground (https://playground.tensorflow.org/) serves as an interactive haven.

Originating in the ingenious workshops of Google Brain, TensorFlow bears the insignia of its creators. Google Brain’s inception traces back to 2011, spearheaded by visionaries Jeff Dean, Greg Corrado, and Andrew Ng. Presently, their legacy resonates within Google Research. A trail of pioneering breakthroughs, ranging from AI infrastructure development (culminating in TensorFlow’s inception) to Sequence-to-Sequence learning, and even pioneering AutoML for automated machine learning tailored for production usage, punctuates their journey.

As I stand on the cusp of what the future holds, the vista appears breathtaking. The data deluge escalates to zettabyte magnitudes, a testament to our evolving technological prowess. I find myself envisioning a future where Data Visualization transcends present horizons. What I currently witness is merely the surface, and I eagerly anticipate the unveiling of its profound depths. The journey ahead promises to be remarkable, as we collectively traverse the unfolding landscape of Data Visualization’s potential.

My pivot from Wall Street trader to Data Science

It's with immense pride that I declare my Peruvian heritage, stemming from a steadfast lineage of immigrant ancestors. The unwavering dedication of my father, observed from an early age, steered me onto a purposeful path. A tenacious spirit has always driven me to attain my goals. I ardently believe that the energy we emit into the universe molds our reality. Rooted in the power of manifestation, I am resolute in my determination to shape a flourishing career in Data Science.

With over a decade of experience as a trader on Wall Street, my journey has been enriched by an unexpected catalyst - a book that ignited my anticipation for the future. "The Industries of the Future" by Alec Ross (https://www.linkedin.com/in/rossalec), a luminary in American technology policy, unveiled before me the prospect of a transformative era. As a former Senior Advisor for Innovation to Secretary of State Hillary Clinton, Ross spearheaded initiatives to keep America at the forefront of innovation globally. These insights from his book stimulated my intellect while I navigated the world of pre-IPO research during my trading ventures.

Within its pages, I uncovered the secrets of "unicorn" companies like Airbnb, Lyft, and Palantir Technologies. Their allure was rooted in their ability to harness colossal volumes of data, catalyzing innovation. I gained a profound realization – data is the monumental force reshaping industries, poised for unyielding growth. This conviction was fortified when I learned that Data Science's projected expansion is a staggering 22%, tripling the national average for all careers. The meteoric rise of the Internet of Things (IoT) market, reaching billions worldwide, is propelling the demand for data-processing chips, perpetuating this data-driven evolution.

Bringing a treasure trove of insights accrued on Wall Street, I am fervently poised to contribute to the Data Science community. This data revolution is irrevocable, an undercurrent of change that is here to stay and flourish, even if unnoticed by the masses.

And as I stand at this juncture, I'm compelled to acknowledge the book that ignited this transformation. It is this relentless pursuit of progress that fuels my daily hustle.

The future I envision is luminous and resonant, illuminated by the convergence of heritage, Wall Street wisdom, and the boundless potential of Data Science.
The book that inspired the change…
My FUTURE